Riding for Smiles is a charity offering inclusive and innovative equestrian based activities to disabled and vulnerable children, young people and adults which are very often free to the participant.
We work with those who have physical, social, learning, behavioural and emotional/mental disabilities or multiple needs and those who are disaffected, excluded or marginalised.
Our sessions and activities provide enjoyable, enrichment experiences and recreational opportunities which develop confidence and self-esteem, self- regulation, positive social interaction, motivation, calmness, thoughtfulness, resilience and provide physical exercise.
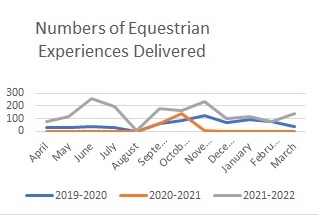
The blue line shows the pre-pandemic figures for 2019-2020.
The orange line shows clearly the periods of lock down with just a few experiences delivered from September to very early November.
The grey line shows the very significant growth in numbers from April of 2021.


